

Editor’s Note: Fun With Numbers will be a weekly feature (look for it on Friday’s) here at the Basketball Society that will give us a chance to have some fun with some statistics.
This Friday, we’re going to focus on one statistic in particular, Opponent Field Goal Percentage (Opp FG%). In the midst of the Golden Age of Analytics, Opp FG% can be viewed![]() as rather old school or simple. Points per game has almost completely been retired for more telling stats like points per possession (Defensive Rating) which has almost become the defacto statistic when rating the best defenses.
as rather old school or simple. Points per game has almost completely been retired for more telling stats like points per possession (Defensive Rating) which has almost become the defacto statistic when rating the best defenses.
But Opp FG% holds up rather well and is a great indicator not only of good defense, but of a good team in general.
Opp FG% vs. Def Rating
It’s logical that holding opponents to a poor shooting percentage would lead to a good defense. But being good at other things, such as creating turnovers, can make you a better defense relative to how well you challenge shots. Take a look at the top ten defenses this season by Opp FG%:
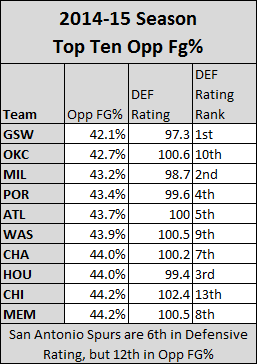
There isn’t a big difference here. For the most part, the best teams at challenging shots are the best in points allowed per possession (Def Rating). But there are a few outliers. For one, Oklahoma City is great at challenging shots, but only tenth in Def Rating. Because of that, we’d consider them closer to an above-average defense rather than an elite defense. That’s partially attributed to them being below average (20th) in forcing turnovers.
Another case that’s pointed out in the graphic is the Spurs ability to be the 6th Defensively Rated team, but only 12th in Opp FG%. That’s partly due to them being ranked 19th in forcing turnovers, but also due to the Spurs being 9th in free throw attempts allowed. The Spurs typically don’t put teams on the line and that’s not factored into Opp FG%.
Opp FG% and Wins
Those are some limitations of Opp FG%, but the one thing that makes Opp FG% a very valuable team state is it’s relationship to wins. Look at that same list of the top ten teams in the NBA this season by Opp FG% and how many wins each team has this season:

It’s not surprising to see Golden State atop any list at this point in the season since they’ve dominated on both sides of the ball. But there is only one team on that list with a losing record, the Charlotte Hornets, and that may not be the case at the end of the season. The only non-playoff team on the list is the Oklahoma City Thunder which speaks more to the loaded West and injuries than the caliber of team that they are.
Only five teams currently with more than 30 wins are excluded and all have either elite offenses, or a Championship pedigree, or both: Raptors, Cavaliers, Clippers, Dallas, and San Antonio. So the second, third, fourth, and sixth best offenses and the Spurs.
NBA Finals Participants and Opp FG%
So, Opp FG% is a pretty good measure of success this season and it’s clear you need to be very good at something else if you aren’t very good at challenging shots, but what about in years past? Let’s take a look at the Opp FG% of NBA Finals participants (Champions and Runners-up) since the year 2000:

To clarify, teams highlighted in red are the outliers, Finals participants that were ranked 10th or worse in Opp FG%. Of those six teams, only three were in the lower half of the league in the metric:
- The 2003-04 Los Angeles Lakers: An aging/dysfunctional championship team trying to get one more.
- The 2006-07 Cleveland Cavaliers: LeBron’s first trip to the Finals (Also related: The Eastern Conference has been bad for a while).
- The 2013-14 Miami Heat: Fourth straight Finals appearance coming out of a far weaker conference and decimated by the Spurs (who were ranked 8th by the way).
Those teams highlighted in yellow are ranked between 6th-9th in Off FG%. For this list, that’s around average, but consider that every one of these teams is in the top ten league-wide for that season. Also, consider the colorful tipping point around 2005-06. Before that, only four of the 12 Finals participants were outside of the top five in Opp FG%. Again, that dysfunctional Lakers team, two teams in the 2001-02 Nets and 1999-00 Pacers that in my opinion would struggle to make the playoffs in the Western Conference this season, and the 2000-01 Lakers who are the true outliers here.
After that point, as offenses become more creative and smarter and better you see Opp FG% lose some of its value relative to the early 2000s.
Lastly, the teams highlighted in green are those teams that were ranked in the top 5 that season in Opp FG%. There are some truly elite and iconic defenses here including the 2003-04 Pistons, 2004-05 and 2006-07 Spurs, the 2007-08 Celtics, and the 20010-11 and 2011-12 Miami Heat. There are also some very good defenses that have gotten a bit forgotten over time such as the 2008-09 Magic and the ridiculous 1999-00 and 2001-02 Lakers.
Of course with new NBA data available to us, knowing Opp FG% in certain areas (at the rim, on 3-point shots, on Corner 3’s) tells us more specific information, but clearly there’s a correlation between Opp FG% and success. That’s backed up by last season’s top ten in Opp FG%, all of whom made the playoffs. And the same for 2012-13. And it’s pretty apparent looking at all of this data that around 44% is a great target.
Of the 30 NBA Finals participants over the last 15 seasons, only six had an Opp FG% above 44%. In last season’s top ten? Only two. Of 2012-13’s top ten? Zero. And the same this season. Holding your opponents to less than 44% shooting won’t guarantee you a spot in the Finals, but it’ll get you in the mix.
Look for our Fun With Numbers feature each Friday and let us know what you think over @BBallSociety_ and @CSaint3.

Come check out my thoughts on the Cavs!!!